Showing posts with label Java. Show all posts

Friday, July 25, 2014

Maven - Checking for dependency updates

If you're using Maven with your Java or Android projects you can leverage its ability to check for new library versions using versions:display-dependency-updates goal, instead of doing that manually through search.maven.org or using services like changedetection.com.

Withing Eclipse, you can create an internal Run Configuration (Run > Run Configurations... > Maven Build):


[INFO] Scanning for projects...
[INFO] 
[INFO] Using the builder org.apache.maven.lifecycle.internal.builder.singlethreaded.SingleThreadedBuilder with a thread count of 1
[INFO]                                                                         
[INFO] ------------------------------------------------------------------------
[INFO] Building MyApplication 1.0.0-SNAPSHOT
[INFO] ------------------------------------------------------------------------
[INFO] 
[INFO] --- versions-maven-plugin:2.1:display-dependency-updates (default-cli) @ myapplication ---
[INFO] The following dependencies in Dependencies have newer versions:
[INFO]   com.squareup.okhttp:okhttp ........................ 2.0.0-RC1 -> 2.0.0
[INFO]   com.squareup.okhttp:okhttp-urlconnection .......... 2.0.0-RC2 -> 2.0.0
[INFO]   com.squareup.picasso:picasso .......................... 2.3.2 -> 2.3.3
[INFO]   commons-io:commons-io ..................................... 2.2 -> 2.4
[INFO]   org.apache.commons:commons-lang3 ........................ 3.1 -> 3.3.2
[INFO] 
[INFO] ------------------------------------------------------------------------
[INFO] BUILD SUCCESS
[INFO] ------------------------------------------------------------------------
[INFO] Total time: 2.555 s
[INFO] Finished at: 2014-07-25T21:57:33+00:00
[INFO] Final Memory: 10M/166M
[INFO] ------------------------------------------------------------------------


Resources:

Friday, November 23, 2012

Eclipse - “Show heap status”

One of the problems people complain about when starting with Eclipse is that it is slow. Then if you search the web you are advised to allocate more memory (RAM) to Eclipse (Java), but how much should you really?

Well, it all depends on the size of your project and the plugins that you use. Allocate too little and Java Garbage Collector will consume a lot of CPU going through the heap trying to remove discarded objects to make room for new ones, allocate too much than you system has free (available) and it will swap extensively to disk (“swap” file) to give you more free RAM.

How would you know if you allocated enough to Eclipse or you might need to allocate more (provided that you see you have the free memory available). This is where Eclipse “show heap status” feature comes in handy.

First of all you need to enable it: Windows > Preferences > General > Show heap status. It will show this little graph in the status bar:
  • left area (lighter) is how much heap it uses at the moment.
  • right area (darker if you right-click it and check show “Heap Max”) is how much is available from what pre-allocated (either through –Xms startup parameter or pushed past –Xms towards –Xmx)
  • hover to get the details in a tooltip;
  • click the garbage can to force a Garbage Collection.

Then look at it while using the project (build etc) – if the heap usage goes towards maximum, the colour will turn red showing that it might be struggling. You can force a garbage collection using the “garbage can”, but that’s a workaround just to finish the job instead of having to restart Eclipse. Use it too much and the JVM will pause to force an early GC.

In my example I have both minimum (-Xms) and maximum (-Xmx) heap size set to the same values (384MB) and at that moment was only using 41 MB out of it (it pre-allocated though the minimum from the system at startup). As you will be using the project it will go up and down, as needed and as GC will do it’s job.

[...]
--launcher.XXMaxPermSize
256M
[...]
-vm
C:\Program Files\Java\jdk1.7.0_09\jre\bin\server\jvm.dll
-vmargs
[...]
-Xms384m
-Xmx384m
So why is my eclipse.exe (javaw.exe) process using 600 MB of RAM when I’ve set my heap to 384 MB? It’s because Heap is not everything, there’s also the Permanent Generation (PermGen) and a few other things, so consider those as well when you decide to increase heap. On Windows use a tool like Process Explorer to see all these details – system commit, free RAM, process private bytes, working set etc.

Tuesday, November 13, 2012

JBoss – Spring JDBC SQL logging (log4j)

You might occasionally need to investigate your application on a customer site (or even in your development environment look at parts of the application you’re not familiar with) from the outside first to see what they do in terms of SQL statements, before diving into the code.

Obviously a solution is to trace the statements at database level, but some databases make it easier than others or might require profiling rights and so on. But what you might have access to is your application log4j configuration.

Here’s an example on how to enable SQL logging for Spring JDBC into a separate file appender.

Note that I defined the loggers so they don’t inherit the appenders from parent packages or the root appenders (additivity=”false”) – you can remove that and they will append to predefined appenders as well as this new one. Whenever finished you can raise the level for those two loggers back to WARN to stop the logging, and if you need to leave it on for longer, see the previous post on how to roll logs. It’s probably not recommended though leaving the SQL logging on in production as it might slow the application or will produce large logs in busy environments.
<appender name="FILE_SQL" class="org.jboss.logging.appender.RollingFileAppender">
   <param name="File"      value="${jboss.server.home.dir}/log/sql.log"/>
   <param name="Threshold" value="TRACE"/>
   <param name="Encoding"  value="UTF-8" />

   <layout class="org.apache.log4j.PatternLayout">
     <param name="ConversionPattern" value="%d %-5p (%t) [%c:%L] %m%n"/>
   </layout>        
</appender>

[…]

<!-- SQL logging -->
<logger name="org.springframework.jdbc.core.JdbcTemplate" additivity="false">
  <priority   value="DEBUG"/>
  <appender-ref ref="FILE_SQL"/>
</logger>

<logger name="org.springframework.jdbc.core.StatementCreatorUtils" additivity="false">
  <priority   value="TRACE"/>
  <appender-ref ref="FILE_SQL"/>
</logger>
Sample output:
2012-11-13 16:51:01,969 DEBUG (http-8080-Processor18) [org.springframework.jdbc.core.JdbcTemplate:569] Executing prepared SQL statement [SELECT id, first_name, last_name, address, city, telephone FROM owners WHERE last_name like ?]
2012-11-13 16:51:01,973 TRACE (http-8080-Processor18) [org.springframework.jdbc.core.StatementCreatorUtils:206] Setting SQL statement parameter value: column index 1, parameter value [Doe%], value class [java.lang.String], SQL type unknown

Thursday, November 1, 2012

JBoss – Daily rolling logs (log4j)

Our standard log4j JBoss application configuration uses with size based, index rolling file appenders, and when having to investigate customers issues that happened a few days back requires quite a bit of navigation to find the particular date and time, or worse if a recurrent problem fills up the log parts, it might loose the information that could’ve otherwise helped. So recently I’ve been looking to implement daily rolling file appenders in a customer site.

Looking at Log4j DailyRollingFileAppender they are advising to use the log4j extras companion classes:

http://logging.apache.org/log4j/1.2/apidocs/org/apache/log4j/DailyRollingFileAppender.html
DailyRollingFileAppender extends FileAppender so that the underlying file is rolled over at a user chosen frequency. DailyRollingFileAppender has been observed to exhibit synchronization issues and data loss. The log4j extras companion includes alternatives which should be considered for new deployments and which are discussed in the documentation for org.apache.log4j.rolling.RollingFileAppender.
You can download the Apache Extras Companion for Apache Log4j from project website, or otherwise from Maven.org - place that in your JBoss / application CLASSPATH and restart the application.

The RollingFileAppender uses a TimeBasedRollingPolicy, controlling when the file is rolled through a SimpleDateFormat pattern (daily, hourly etc). Optionally it can compress the archive log by adding the .gz/.zip extension to the filename. You can also move the archive logs into a separate location.
   <!-- SERVER.LOG -->
   <appender name="FILE" class="org.apache.log4j.rolling.RollingFileAppender">
     <!-- Active log file name -->
     <param name="File"     value="${jboss.server.home.dir}/log/server.log" />
     <param name="Append"   value="true" />
     <param name="Encoding" value="UTF-8" />

     <rollingPolicy class="org.apache.log4j.rolling.TimeBasedRollingPolicy">
       <!-- Archive file to roll to @ midnight (yyyy-MM-dd) with compression -->
       <param name="FileNamePattern" value="${jboss.server.home.dir}/log/archive/server.%d{yyyy-MM-dd}.log.zip" />
     </rollingPolicy>

     <layout class="org.apache.log4j.PatternLayout">
       <param name="ConversionPattern" value="%d %-5p [%t] [%c{1}:%L] %m%n"/>
     </layout>
   </appender>

Friday, July 20, 2012

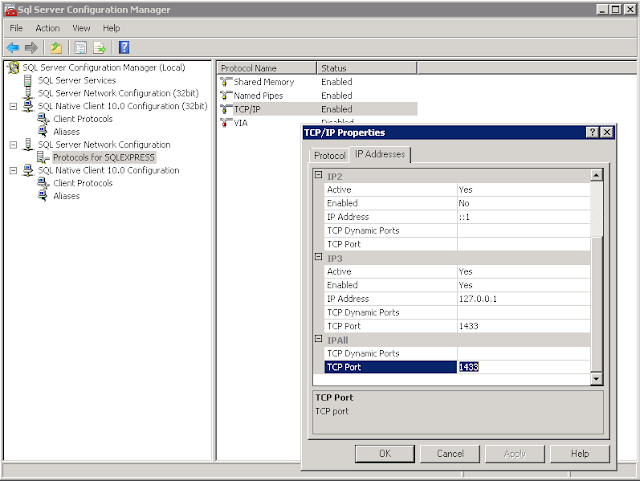
Java not connecting to Microsoft SQL Server 2008 R2 Express

Although Microsoft SQL Server 2008 R02 Express was configured correctly to accept TCP/IP connections (SQL Server Configuration Manager > SQL Server Network Configuration > Protocols for SQLEXPRESS), a test connection from Squirrel SQL is just hanging with “Connecting…” message.


My context:

Process Explorer showing that SQuirrel SQL (javaw.exe) was in fact it connected on port 1433, but not able to finish the connection process. That was also confirmed by the fact that when restarting SQL Express server, SQuirrel SQL was coming back promptly.


Most of the answers on the Internet will tell you how to configure SQL Express for TCP/IP connections and that you might need to add a rule to the firewall - that wasn’t really necessary in my case as I only needed local connections.

Eventually I found this post on stackoverflow.com where a user reports having similar problems with Java 1.6.0_29:

Related post on Microsoft JDBC team blog:

Updating my environment to use Java 1.6.0_33 solved the problem.

Monday, April 16, 2012

Java - String.format(), Formatter.format(), StringUtils performance

I’m re-writing a module I wrote a few years ago to improve performance and meet the customer requirements – we’re talking about up to 200.000 XML messages per day, with 90 messages / sec at peak times, to get an idea about how many times these methods are being called, every bit of wasted time / resources is considerably multiplied.

I’ve already done various things like reducing number of operations and waste in objects being created, but now I’m down to lower level inner parts.

Been using TreeMaps to cache some search data and avoid trips to the database, and the first implementation was using multi-keyed objects (containing multiple string keys) and comparator classes; although it was nice using typed objects as map keys it was on the other hand a bit wasteful and slower. I’ve since changed those to plain “packed” string keys, to reduce the number of objects being created, with the disadvantage of loosing the typing in the process, but it does run faster.

I did mention in the previous post that I’ve used recently VisualVM to sample application activity and spotted that these little pack() methods took somewhat an unusual amount of time - still looking in reducing the number of operations, but I said hey let’s see if they can be improved with little effort.


What the code does is fairly straight forward, takes multiple strings (“a” - “b” - “c”) and packs them all together into a padded, upper-cased string key, keeping the field lengths as in the database. That to ensure the resulting keys can be ordered and searched using get() and subMap() methods.

Although been using Apache Commons Lang packages for years now and if using Maven in Eclipse you can always look at the sources to see how exactly they do things, I chose String.format() as it should be faster, right? Well, apparently I wasn’t right. Started writing a simple performance test to compare with Formatter and then I thought lets add a StringUtils implementation and see how it fares…

First, it just seems that String.format() was the slowest and StringUtils was the fastest! And second, String.format() is not so bad in Java 7 (although it might not seem so as the tests seem to run in different order).

Java HotSpot 6
(1.6.0_31 x64)
Win 2008 R2 SP1 x64
Java HotSpot 7
(1.7.0_03 x64)
Win 2008 R2 SP1 x64
String.format() 110 ms 63 ms
Formatter.format() 47 ms 94 ms
StringUtils 15 ms 16 ms

I repeated the tests a few times and although obviously timings change slightly between runs, but StringUtils is consistently a few times faster. Obviously the test doesn’t measure in any way the garbage collection costs and have no idea how it will fare in the application performance tests just yet, but does promise a slight improvement with little code changes.

Posting the code for review, in case I’m missing something – using junit-4.10.jar and commons-lang-2.6.jar (http://search.maven.org/).
import java.util.Formatter;

import org.apache.commons.lang.StringUtils;
import org.apache.commons.lang.time.StopWatch;
import org.junit.BeforeClass;
import org.junit.Test;

public class PerfTest {
  /**
   * Constants
   */
  private int MAX_COUNT = 1000;
  
  /**
   * 
   */
  @BeforeClass
  public static void javaInfo() {
      System.out.println(String.format("java version \"%s\"", System.getProperty("java.version")));
      System.out.println(String.format("%s (build %s)",       System.getProperty("java.vm.name"), System.getProperty("java.vm.version")));
      System.out.println();
  }
  
  /**
   * String.format() test
   */
  @Test
  public void test1() {
    StopWatch stopWatch = new StopWatch();
    stopWatch.start();
    
    String result = StringUtils.EMPTY;
    for (int i = 0, n = MAX_COUNT; i < n; i++) {
      result = String.format("|%-5S|%-10S|%-15S|", "a", "bb", "ccc");
    }
    
    stopWatch.stop();
    System.out.println("String.format()    = " + result);
    System.out.println("Execution time     = " + stopWatch.toString());
    System.out.println();
  }
  
  /**
   * Formatter.format() test
   */
  @Test
  public void test2() {
    StopWatch stopWatch = new StopWatch();
    stopWatch.start();
    
    String result = StringUtils.EMPTY;
    for (int i = 0, n = MAX_COUNT; i < n; i++) {
      Formatter formatter = new Formatter();
      result = formatter.format("|%1$-5S|%2$-10S|%3$-15S|", "a", "bb", "ccc").toString();
    }
    stopWatch.stop();
    System.out.println("Formatter.format() = " + result);
    System.out.println("Execution time     = " + stopWatch.toString());
    System.out.println();
  }
  
  /**
   * StringUtils test
   */
  @Test
  public void test3() {
    StopWatch stopWatch = new StopWatch();
    stopWatch.start();
    
    String result = StringUtils.EMPTY;
    for (int i = 0, n = MAX_COUNT; i < n; i++) {
      result = '|' + StringUtils.rightPad(StringUtils.upperCase("a"),    5)
             + '|' + StringUtils.rightPad(StringUtils.upperCase("bb"),  10)
             + '|' + StringUtils.rightPad(StringUtils.upperCase("ccc"), 15)
             + '|';
    }
    stopWatch.stop();
    System.out.println("StringUtils        = " + result);
    System.out.println("Execution time     = " + stopWatch.toString());
    System.out.println();
  }
}

Friday, April 13, 2012

JXplorer - Java LDAP Browser

http://jxplorer.org/

JXplorer is an open source ldap browser originally developed by Computer Associates' eTrust Directory development lab. It is a standards compliant general purpose ldap browser that can be used to read and search any ldap directory, or any X500 directory with an ldap interface. It is available for immediate free download under a standard OSI-style open source licence.


Thursday, April 12, 2012

JBoss 4.2.3 with VisualVM

I have recently been involved in implementing and testing our application in a high volume / high performance customer case, where I thought I might try using VisualVM to see the JVM in action and find potential bottlenecks, like where would most of the CPU usage would go (the module I’m writing is a big CPU hog) as well as maybe latency issues caused by inadequate garbage collector settings.

The screenshots below are taken from a much smaller test environment where I just ran a quick test, but I have been able to use the tool in the customer environment where we were able to identify occasional high CPU usage with garbage collection (the blue line in the CPU area, left) as well as OutOfMemory problems due to the default garbage collection strategies (notice the erratic/irregular shapes in heap usage on the right side) - both can be addressed by adjusting the garbage collector strategy for low pause, concurrency (using -XX:+UseConcMarkSweepGC and -XX:+UseParNewGC parameters, see "before" and "after" screenshots below).

Also we found high CPU usage on certain application threads that now we can focus to optimize the code in those areas, they are not part of these screenshots, but I might post separately on that. Also from the threads graph is visible we have a high number of threads  with a short life span, probably around the JMS connectivity area that we’re still investigating.

I’m nowhere even close to being an expert on these things, I’m still learning the stuff, but since I struggled a bit to get the JMX enabled with JBoss 4.2.3, though I might share the findings others might find useful and why not even got some more qualified suggestions from you, the readers out there.
We’re using the Java Service Wrapper (just to give you another example of how to use the parameters) and these are the settings I used to allow for remote JMX connectivity (the port is your choice really):
wrapper.java.additional.14=-Djavax.management.builder.initial=org.jboss.system.server.jmx.MBeanServerBuilderImpl
wrapper.java.additional.15=-Djboss.platform.mbeanserver
wrapper.java.additional.16=-Dcom.sun.management.jmxremote
wrapper.java.additional.17=-Dcom.sun.management.jmxremote.port=9999
wrapper.java.additional.18=-Dcom.sun.management.jmxremote.ssl=false
wrapper.java.additional.19=-Dcom.sun.management.jmxremote.authenticate=false
Once setup you can just run VisualVM and point it to localhost:9999 if you’re going to do the monitoring locally, although probably for a high performance environment you might want to run VisualVM from another machine, so it doesn’t affect the environment too much. Just as well, with the JMX enabled you can probably use that from a monitoring application and set warning thresholds for things like free JVM memory, high CPU usage etc.

VisualVM seems to be quite a capable tool (not to mention easy on the eye), giving you real time information through the graphs, being able to take memory dumps to analyze offline (with say the likes of Eclipse Memory Analyzer), perform garbage collection, take thread dumps, look at active / dead threads or run a CPU sampler to see the top consumer threads.


Wednesday, March 14, 2012

JBoss 4.2.3 with Apache Portable Runtime (APR)

http://www.jboss.org/jbossweb/native

By default JBossWeb uses the standard pure-Java implementation and you can observe this in the log:

INFO  [AprLifecycleListener] The Apache Tomcat Native library which allows optimal performance in production environments was not found on the java.library.path: [...]
INFO  [Http11Protocol] Initializing Coyote HTTP/1.1 on http-0.0.0.0-8080
INFO  [Http11Protocol] Initializing Coyote HTTP/1.1 on http-8443
INFO  [AjpProtocol] Initializing Coyote AJP/1.3 on ajp-0.0.0.0-8009
INFO  [Catalina] Initialization processed in 1118 ms
INFO  [StandardService] Starting service jboss.web
INFO  [StandardEngine] Starting Servlet Engine: JBossWeb/2.0.1.GA
INFO  [Catalina] Server startup in 93 ms

where with native libraries installed it will look like this:

INFO  [main] [org.jboss.wsf.stack.jbws.NativeServerConfig:51] JBoss Web Services - Native
INFO  [main] [org.jboss.wsf.stack.jbws.NativeServerConfig:52] jbossws-3.0.1-native-2.0.4.GA (build=200803312044)
INFO  [main] [org.apache.catalina.core.AprLifecycleListener:181] Loaded Apache Tomcat Native library 1.1.22.
INFO  [main] [org.apache.catalina.core.AprLifecycleListener:189] APR capabilities: IPv6 [false], sendfile [true], accept filters [false], random [true].
INFO  [main] [org.apache.coyote.http11.Http11AprProtocol:113] Initializing Coyote HTTP/1.1 on http-0.0.0.0-8080
INFO  [main] [org.apache.coyote.ajp.AjpAprProtocol:166] Initializing Coyote AJP/1.3 on ajp-0.0.0.0-8009
INFO  [main] [org.apache.catalina.startup.Catalina:536] Initialization processed in 992 ms
INFO  [main] [org.apache.catalina.core.StandardService:507] Starting service jboss.web
INFO  [main] [org.apache.catalina.core.StandardEngine:431] Starting Servlet Engine: JBossWeb/2.0.1.GA
INFO  [main] [org.apache.catalina.startup.Catalina:584] Server startup in 39 ms

To enable APR, download the appropriate package for the environment from http://www.jboss.org/jbossweb/native and extract into jboss\bin – in my case a Windows server, and that would be tcnative-1.dll and openssl.exe. They need to be in the application path, if it doesn’t find them JBoss will revert to standard Java implementation.

One problem now is that APR uses openssl.exe and the HTTPs configuration has to be changed, but I didn’t look too much into that, since my environment doesn’t require it I just commented it out; otherwise it will throw an exception at start-up complaining about the setup of the secure connector.

jboss\server\default\deploy\jboss-web.deployer\server.xml
~~~~~~~~~~~~~~~~~~~~~~~~~~~~~~~~~~~~~~~~~~~~~~~~~~~~~~~~~
 <!-- Define a SSL HTTP/1.1 Connector on port 8443
      This connector uses the JSSE configuration, when using APR, the 
      connector should be using the OpenSSL style configuration
      described in the APR documentation
   <Connector port="8443" protocol="HTTP/1.1" SSLEnabled="true"
           maxThreads="150" scheme="https" secure="true"
           clientAuth="false"
           keystoreFile="${jboss.server.home.dir}/conf/ssl-keystore.jks"
           keystorePass="hgf8tx" sslProtocol="TLS" />
-->

Restart JBoss and check the performance.

Wednesday, November 2, 2011

Eclipse – FindBugs plugin

buggy-sm
http://findbugs.sourceforge.net
FindBugs™ - Find Bugs in Java Programs

A program which uses static analysis to look for bugs in Java code.  It is free software, distributed under the terms of the Lesser GNU Public License. The name FindBugs™ and the FindBugs logo are trademarked by The University of Maryland. As of July, 2008, FindBugs has been downloaded more than 700,000 times.


Thursday, May 15, 2008

How to configure HermesJMS to connect to JBoss JMS

http://www.hermesjms.com/

HermesJMS is an extensible console that helps you interact with JMS providers making it easy to browse or seach queues and topics, copy messages around and delete them. It fully integrates with JNDI letting you discover administered objects stored, create JMS sessions from the connection factories and use any destinations found. Many providers include a plugin that uses the native API to do non-JMS things like getting queue depths (and other statistics) or finding queue and topic names.

Here is a great step by step video tutorial showing you how to configure the connection to JBoss JMS.
http://hermesjms.com/confluence/display/HJMS/JBoss+Tutorial

* * *

If you follow the tutorial exactly but you still get an error like "No message, linked exception is: null" and an an exception like java.net.MalformedURLException: no protocol: Files/HermesJMS/lib.weaved/hermes-ems.jar in the hermes.log, then is mostly likely caused by the fact that you have installed the application in C:\Program Files or the like. Uninstall and then reinstall the HermesJMS in a path without spaces, if you want it in Program Files, use something like C:\Progra~1\HermesJMS - it will keep the settings, you won't have to make them all over again.